 Publishing active
Snapshot publisher
Sanitized, allowlisted observations
Systems / Homelab
Jimmy Perron / Systems
Logical services and data flows. Documented architecture, not live telemetry.


Local monitoring and public reporting are separate concerns.
Publishing active
Sanitized, allowlisted observations
 Deployed
Validates the public data feed
Public snapshot storage
 Existing
Reads public snapshots via the API
Snapshot publishing is active. This is a documented deployment status, not a live health indicator.
 Field sensors
Hardware planned
Mosquitto
Service existing
Node-RED
Service existing
InfluxDB / .NET
IoT views planned
Simulator integration exists. The complete field-to-dashboard path is planned and separate from infrastructure monitoring.
System path
ESP32 · Arduino · LoRa
Wi-Fi · MQTT
Node-RED flows
InfluxDB · MariaDB
Grafana · Ollama summaries (planned)
Distributed nodes measure soil conditions, move readings through LoRa and MQTT, preserve history, and support irrigation decisions from one dashboard.
Platform layers
Cloudflare validates the sanitized public data feed.
Worker API · D1Containerized services support applications and local processing.
DockerPrometheus collects infrastructure observations for local Grafana dashboards. IoT measurements follow a separate planned path.
Prometheus · GrafanaOllama runs on AI Server. The planned AI layer will summarize collected IoT data alongside existing coding experiments.
Ollama · Qwen CoderApplication experiments and repeatable infrastructure.
Git · .NET · Blazor · PythonArchitecture, procedures and lessons stay understandable.
Obsidian · Markdown · GitOperating principles
The objective is to protect production throughput by identifying technology constraints before they become operational constraints.
The real advantage of an AI-native platform isn’t necessarily that AI writes the software. It’s that the platform is built so both humans and AI can understand, operate, and maintain it.
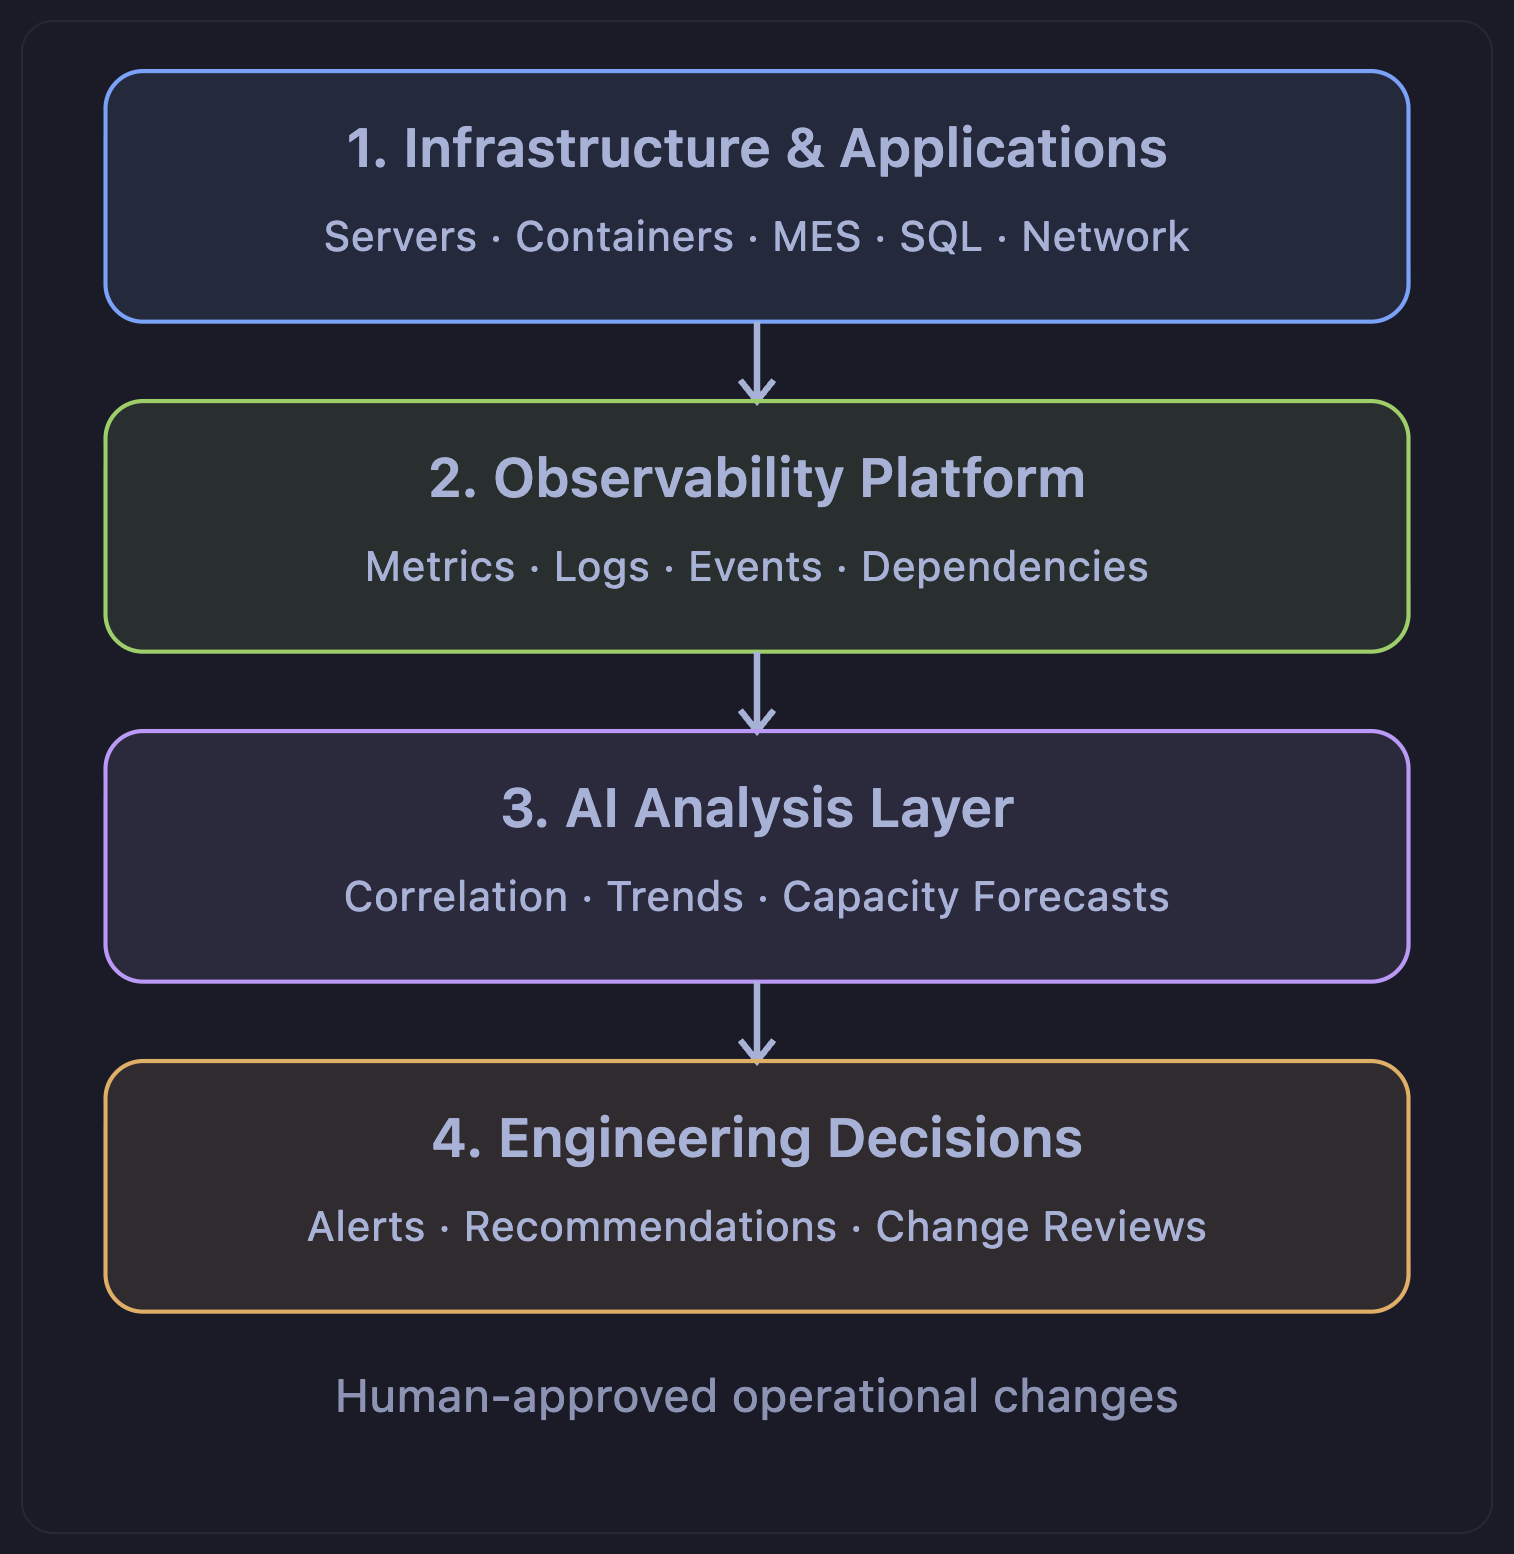
Human-approved operational changes


